Elyza Mae Mariano
BEED-3
Drawing

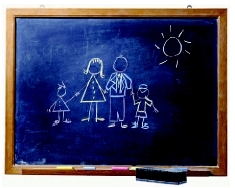
Drawing by a young child depicting a family.
Bar Graph

This particular bar graph shows how much money is spent on transportation for people in different household-income groups. It appears that as household income increases, the total expenditures on transportation also increase. This makes sense, because the more money people have, the more they have available to spend.
Poster
This is an example of a Flowchart with making a friend. This is an
easier graph to understand and shows the way the decisions in the
flowchart affects the final outcome.


Walang komento:
Mag-post ng isang Komento